Audit an Azure Synapse Analytics Dedicated SQL Pool – Keeping Data Safe and Secure

- Log in to the Azure portal at https://portal.azure.com ➢ enter Log Analytics Workspaces in the Search box and select it from the drop‐down ➢ click the + Create button ➢ select a subscription ➢ select a resource group ➢ enter a name (I used brainjammer) ➢ select a region ➢ click the Review + Create button ➢ and then click Create.
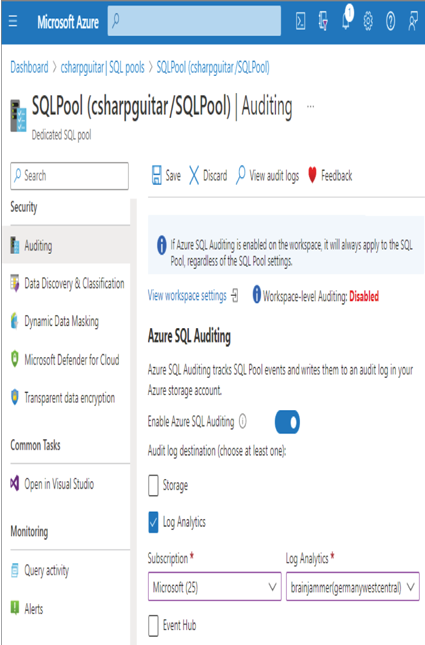
- Navigate to the Azure Synapse Analytics workspace you created in Exercise 3.3 ➢ select the SQL Pools navigation menu item ➢ select your dedicated SQL pool ➢ start the dedicated SQL pool ➢ select the Auditing navigation menu item ➢ set the Enable Azure Auditing toggle switch to on ➢ select the Log Analytics check box ➢ select the subscription where you placed the Log Analytics workspace from step 1 ➢ select the workspace from the Log Analytics drop‐down list box ➢ and then click Save. The configuration should resemble Figure 8.23.

FIGURE 8.23 Dedicated SQL pool auditing configuration
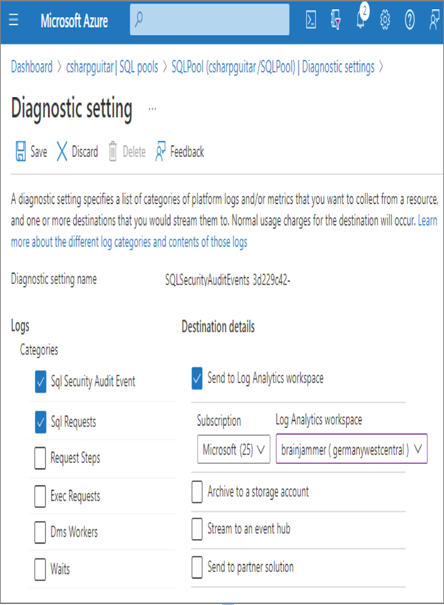
- After some minutes, navigate to the Diagnostic Settings navigation menu item for the dedicated SQL pool ➢ notice the setting prefixed with SQLSecurityAuditEvents_ ➢ click the Edit Setting link associated with that diagnostic setting ➢ check the Sql Requests check box ➢ and then click Save. The configuration should resemble Figure 8.24.

FIGURE 8.24 Dedicated SQL pool Diagnostic setting configuration
- After some minutes, execute the following query on the dedicated SQL pool configured in the previous steps:
SELECT * FROM [dbo].[SUBJECTS] - After some minutes, select the View Audit Logs menu button (refer to Figure 8.23) ➢ click the Log Analytics menu button ➢ and then execute the default query. An example query is available on GitHub in the Chapter08/Ch08Ex04 directory. The output should resemble Figure 8.25.

FIGURE 8.25 View dedicated SQL pool audit logs in Log Analytics.
- Stop the dedicated SQL pool.
The first step taken in Exercise 8.4 resulted in the provisioning of an Azure Log Analytics workspace. This is the recommended location to store, analyze, and manage audit logs. Chapter 9, “Monitoring Azure Data Storage and Processing,” includes detailed coverage of Azure Log Analytics, including monitoring.
The provisioning was very straightforward, so at this point all you need to know is that Log Analytics is an optimal datastore for storing audit and diagnostic logs generated by Azure products. After selecting the Auditing navigation menu item bound to the dedicated SQL pool, you were presented with a blade that looked similar to Figure 8.23. There are a few points to call out on this blade.
The exercise instructed you to configure auditing for the dedicated SQL pool; however, there is another option that enables auditing for all SQL pools in the Azure Synapse Analytics workspace. This level of auditing was not needed to experience the desired learning from the exercise, but in a real enterprise implementation of a data solution that uses multiple SQL pools, you should consider enabling auditing for all SQL pools.
Diagnostic Settings is a very helpful feature for most of the Azure products. Like Log Analytics, a full description of this feature is coming in Chapter 9. When you enabled auditing, a default setting was created to capture SQL security audit events. You modified the setting to add SQL requests to the events that are captured and stored into Log Analytics. After completing the configuration and running a SQL statement on any table hosted in the dedicated SQL pool, you reviewed the logs. When you clicked the View Audit Logs menu button, as shown in Figure 8.23, you were navigated to the Log Analytics workspace.
The Log Analytics query editor enabled you to execute queries against the audit data being stored into it. Exercise 8.4 used the following query:
SQLSecurityAuditEvents
| where Category == ‘SQLSecurityAuditEvents’
| project EventTime, Statement, Succeeded, AffectedRows, ResponseRows,
ServerPrincipalName, ClientIp, ApplicationName, AdditionalInformation,
DataSensitivityInformation, DurationMs, ClientTlsVersion,
IsServerLevelAudit, IsColumnPermission
| order by EventTime desc
| take 100
The query retrieves audit records from a Log Analytics table named SQLSecurityAuditEvents, where the value stored in the Category column is equal to SQLSecurityAuditEvents.
The SQLSecurityAuditEvents table includes many columns. By using project, the returned dataset is limited by the columns identified following that keyword. The dataset is ordered by EventTime and limited to 100 rows. Some interesting data included in the result is the SQL statement that was executed, who executed it, and the IP address from the machine that performed the query. There will be more discussion around these columns later, after you set some sensitivity labels and data classifications for data columns.
Manage Sensitive Information
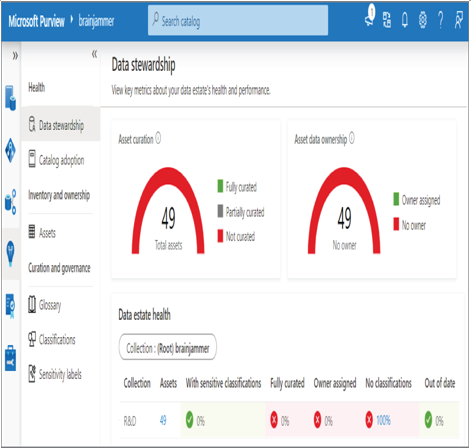
The tool capable of discovering and auditing your data is Microsoft Purview, which can search all your data real estate hosted on Azure, on‐premises, and even on other cloud provider platforms. In Exercise 8.3, you used Microsoft Purview to scan a dedicated SQL pool to identify the assets within it. Figure 8.26 shows the result of that scan. The result is accessible on the Data Estate Insights hub within the Microsoft Purview Governance portal.

FIGURE 8.26 Scanning a dedicated SQL pool with Microsoft Purview
The scan found 49 total assets that have neither sensitivity labels nor classifications. This is because neither of those activities has been performed yet. Something like what you saw previously in Figure 8.11 needs to be carried out on the data. That example of data classification was illustrated from another tool for managing sensitive data, Data Discovery & Classification, which, when used in combination with Auditing, can be used to target dedicated SQL pools running in an Azure Synapse Analytics workspace. Complete Exercise 8.5, where you will apply sensitivity labels and data classifications.

Leave a Reply